Whether you call it renovation, progress or gentrification, it is undeniable that our neighborhood is going through a process of change. The response ranges from aesthetic discomfort to international media coverage, and generally carries a lot of emotion. Therefore, we decided to take a closer look at local building projects completed in the recent years, and what we found out will surprise you!
So…. How many buildings?
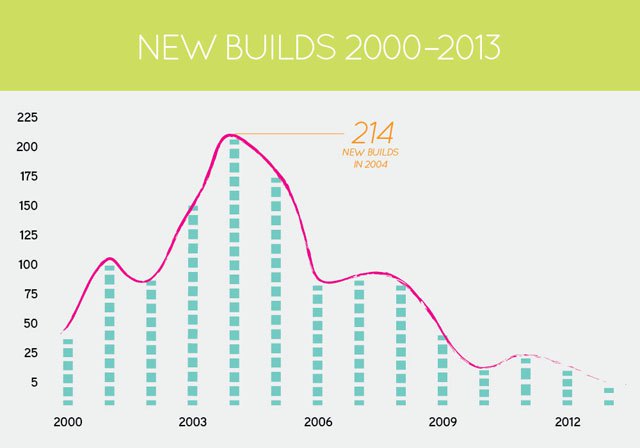
Using PLUTO’s database, we found that this urban transformation has been taking place since 2000 through 541 renovations and 1089 new constructions. We sorted the latter by completion date and created the graphic that shows the amount of new buildings per year (see above). You can see how the construction boom of the early aughts had its highest spike in 2004 reaching the maximum of 214 new buildings; the tendency started declining towards the 2008 economic crisis. We were particularly interested in the post-crisis constructions, because the amount of buildings completed between 2009 and 2013 (PLUTO’s data contains information up to October 2013) was less than the total of buildings completed in any year previous to the economic collapse.
Where are they and what is their use?
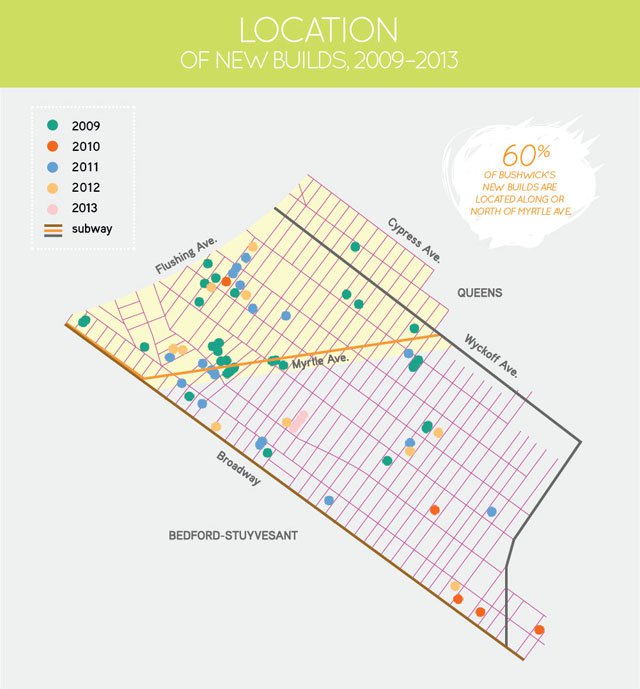
Out of the 87 constructions completed since 2009, 8 of them are commercial, 2 are industrial and 2 are parking buildings. The remaining 75 builds (representing 86% of the total) are used for housing or housing in combination with commercial uses. Unfortunately, 10 buildings with mixed-use only feature retail or office uses, none of them includes community services or public institutions that serve cultural, medical or educational purposes.